REDWOODS magazine: This article was created for our magazine that features redwoods news, breathtaking photos, answers to readers’ questions, stories of how we are realizing our vision for our next century, and how you can help the forest.
After a decade of studying the impacts of climate change throughout redwood forests, the Redwoods and Climate Change Initiative (RCCI) shares new insight into how coast redwood trees are growing today.
By Emily Burns, PhD, and Stephen Sillett, PhD
Glossary
BARK: an outer nonliving layer and an inner living layer through which sugars travel from leaves to the rest of the tree, including its roots.
BIOMASS: the amount of organismal material expressed as dehydrated (oven-dried) weight. In the case of trees, biomass includes leaves, bark, and wood.
HEARTWOOD: older, denser, nonliving central wood of trees that has chemical protection from decay in some species.
SAPWOOD: young and partially living wood beneath the inner bark of a tree through which water and dissolved nutrients travel from roots to leaves.
Earth’s climate is changing rapidly, and redwoods are responding. Mature trees alive today have already experienced centuries of climatic fluctuations, including extreme weather predicted to become more frequent. The Redwoods and Climate Change Initiative (RCCI), a research program led by Save the Redwoods League and Humboldt State University, takes a comprehensive look back in time, using tree rings to see what happened when these trees survived droughts and fire. The study compares trees living in northern rainforests with those living in drier forests farther inland and south. Our research began in old-growth forests and is now expanding into second-growth (previously logged) forests, encompassing the full geographic range of coast redwoods (Sequoia sempervirens) (FIGURE 1).
In every part of the forest, our findings show the tremendous carbon sequestration capacity of redwoods, their ability to resist fire, drought, and disease, and where they grow fastest.
Understanding how redwoods respond to climate change begins with the fundamentals of their biology — how trees of different sizes and ages produce biomass (leaves, bark, and wood), and how different environmental conditions influence rates of production.
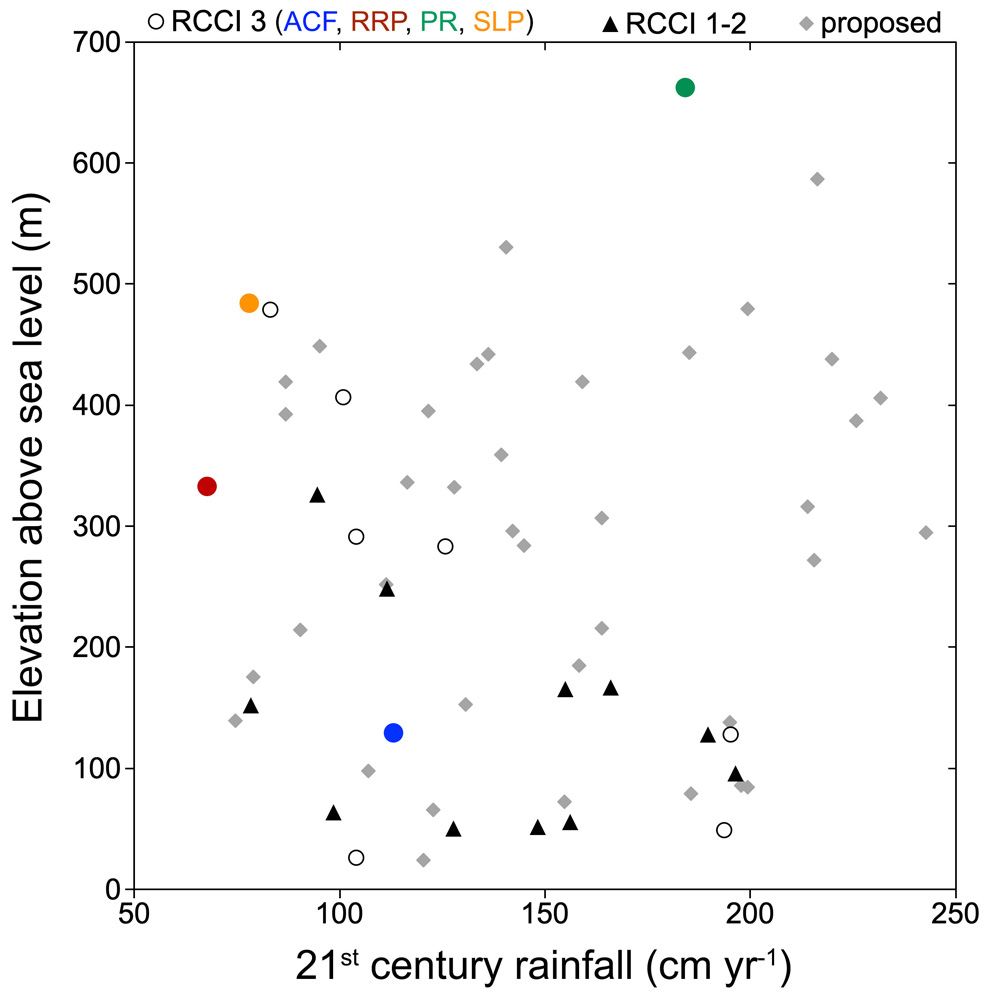
FIGURE 1: ELEVATION AND AVERAGE RAINFALL.The coast redwood forest ecosystem spans a significant climate and elevation gradient along the coast from extreme southwestern Oregon to central California. Shown here are elevations and average annual rainfall (2001-2018) for RCCI locations. Black triangles indicate 1-ha plots established 2009-2012 and remeasured 2015-2017 (RCCI 1-2). Circles indicate recently studied locations completed in 2018 (RCCI 3) with four highlighted in color, including two second-growth forests (ACF = Arcata Community Forest, RRP = Redwood Regional Park) and two old-growth forests (PR = Peavine Ridge, Humboldt Redwoods State Park, SLP = Santa Lucia Preserve). Note that RRP and SLP are two of the driest forests, while PR is one of the wettest. Gray diamonds indicate locations being considered for sampling in 2019 and 2020.
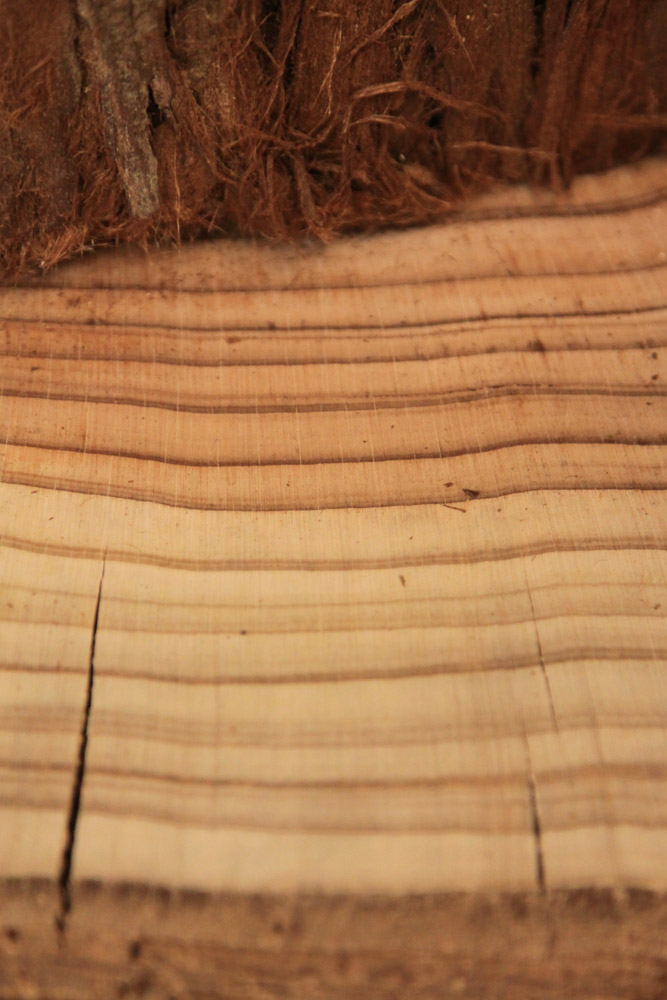
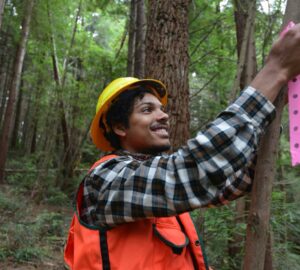
At Humboldt State University, we developed an innovative approach to quantify aboveground dimensions and annual growth histories of standing trees, showing that redwoods are exquisitely responsive to drought, fire, and adjacent logging. To create these windows into the past, we venture into the canopy to measure crowns and collect tree-ring samples from trunks at regular height intervals. Each year of growth is recorded in a discrete band of wood. These rings range from small rings (< 1 mm) made after fire or during drought, to much larger rings made when trees are uninjured, with plentiful access to light, water, and soil nutrients.
Using newly developed equations and annual growth increments measured from tree rings, we can now accurately predict production rates of biomass in redwoods of all sizes (FIGURE 2). Reconstructed growth histories document how individual trees gain height and accumulate biomass with increasing age. Redwoods gain height rapidly in second-growth forests, reaching 87 m (287 ft) tall in 135 years, but biomass accumulation in the tallest second-growth forests is much lower than in the tallest old-growth forests (FIGURE 3). Older redwoods gain biomass rapidly simply because they have large crowns full of leaves conducting photosynthesis and an expansive surface area of cambium for production of bark and wood (Sillett et al. 2015b). Cumulatively over centuries, this results in incredible biomass storage in individual trees and the forest as a whole. Rainforests in California’s Del Norte County, which borders Oregon, hold the world record for aboveground biomass, at more than 5,000 Mg ha-1 (2,023 metric tons per acre; Van Pelt et al. 2016), which means in an area nearly the size of two football fields, there is enough heartwood to build 212 homes!
With red heartwood capable of resisting decay for millennia, individual coast redwoods can live over 2,500 years and accumulate over 400 Mg of aboveground biomass, the bulk of which is heartwood (Sillett et al. 2015b). While logged forests lost their major carbon stock when the original trees were cut, our research shows that the oldest second-growth redwood forests alive today have accumulated as much as 1,667 Mg ha-1 (675 metric tons per acre, Sillett et al. 2019). In other words, second-growth redwood forests can accumulate about a third as much aboveground biomass as comparable old-growth forests in much less than 200 years, though the proportion of decay-resistant heartwood is considerably lower (56% vs. 76%, FIGURE 3).
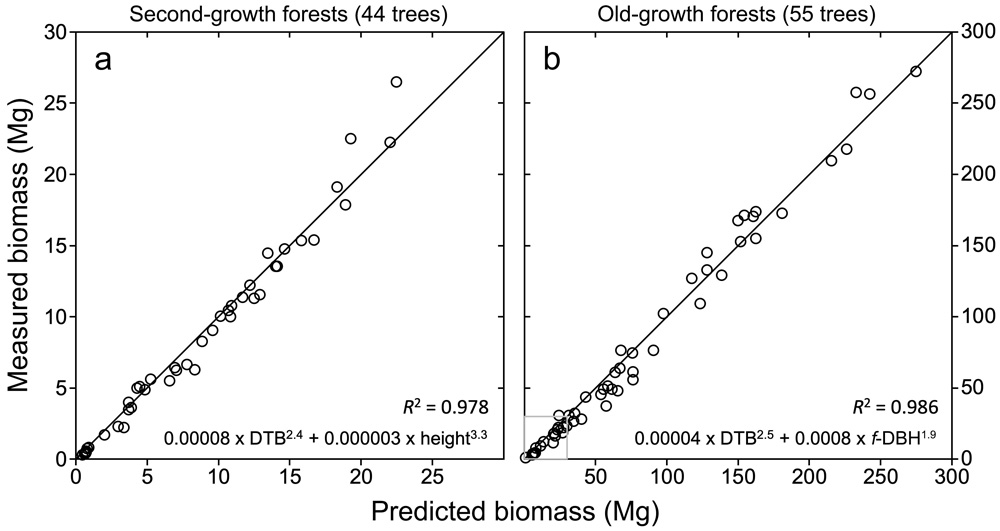
FIGURE 2: MEASURED AND PREDICTED BIOMASS. Climbing and measuring main trunks and all branches of 99 coast redwoods allowed us to develop robust allometric equations for the species in second-growth and old-growth forests. These equations can accurately predict aboveground quantities of leaves, bark, cambium, sapwood, and heartwood in standing trees from simple measurements of trunk and crown size. With the power to accurately predict biomass from simple measurements taken from the base of redwoods, climbing will no longer be necessary to estimate tree biomass and carbon storage in forests with any size trees — saving both time and money in future studies. Shown here are the best equations to predict aboveground biomass (total dry mass, metric tons) in second-growth and old-growth forests (Sillett et al. 2015, 2019) using ground-based measurements. Equations are stepwise power functions of allometric predictors: trunk diameter at top of buttress (DTB, cm), tree height (m), or trunk functional diameter at breast height (f-DBH, cm) with goodness of fit indicated by R2. Diagonals are lines of perfect prediction. The gray box in lower-left corner of chart b shows scale of chart a.
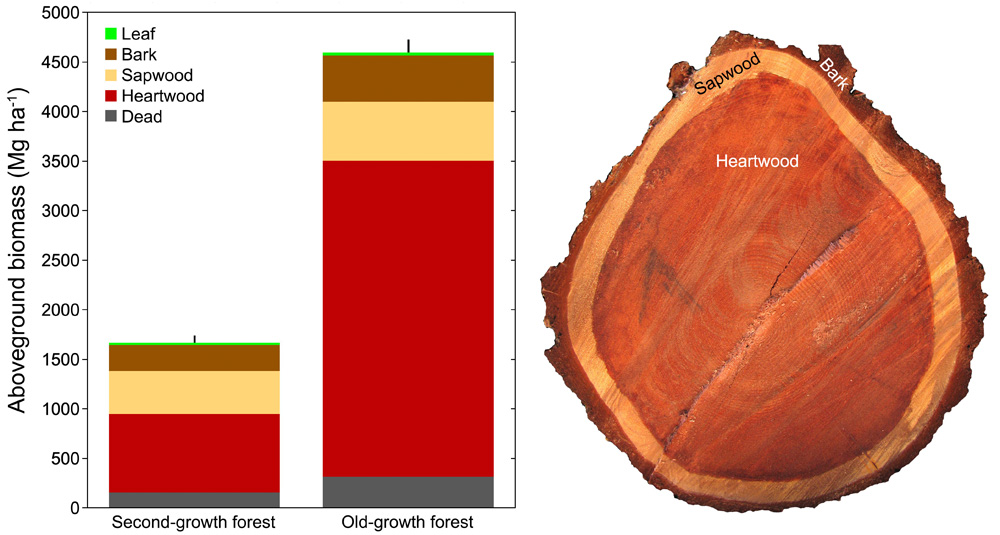
FIGURE 3. BIOMASS ACCUMULATION. Redwoods gain height rapidly in second-growth forests, but biomass accumulation (and therefore, significant carbon storage) in the tallest second-growth forests is much lower than in the tallest old-growth forests. This figure compares biomass estimates expressed as metric tons per hectare for a mature, second-growth forest (logged 1858) in Mendocino Headlands State Park and an old-growth forest in Humboldt Redwoods State Park (Sillett et al. 2019). Both are low-elevation, alluvial forests overwhelmingly dominated by coast redwoods, which hold more than 99.8% of aboveground biomass. Vertical black lines above each column indicate measurement uncertainty expressed as one standard error of total biomass. The sawed cross-section on the right shows bark, sapwood, and heartwood tissues of a trunk from a second-growth forest in Sonoma County. Between the bark and sapwood layers is the small tissue layer called the cambium, which creates both new bark and wood as the tree grows and recovers from injury.
If the future climate and our stewardship continue to support recovery of second-growth forests, then these redwoods will increasingly provide measurable benefits in greenhouse gas reduction as they regain the stature of old-growth forests. However, comparison of historically wet and dry forests reveals that redwoods produce biomass at highly variable rates as climate changes. For example, forests exhibited different responses to the severe drought of 2012-2015 with redwoods in wetter forests maintaining high productivity through the drought, and those in old-growth forests producing the most wood by far. To illustrate these major differences in productivity across the coast redwood ecosystem, we highlight two exemplary northern locations in Humboldt County — Arcata Community Forest (second-growth) and Peavine Ridge at Humboldt Redwoods State Park (old-growth) — as well as two southern locations — Redwood Regional Park (second-growth in Alameda and Contra Costa counties) and the Santa Lucia Preserve (old-growth in Monterey County). In the second-growth forests, dominant trees gained height and biomass rapidly with rates varying by location (that is, trees gained height faster in wetter Arcata Community Forest). Growth trajectories in the old-growth forests were more variable, with some currently dominant trees suppressed by taller neighbors during previous centuries (FIGURE 4).
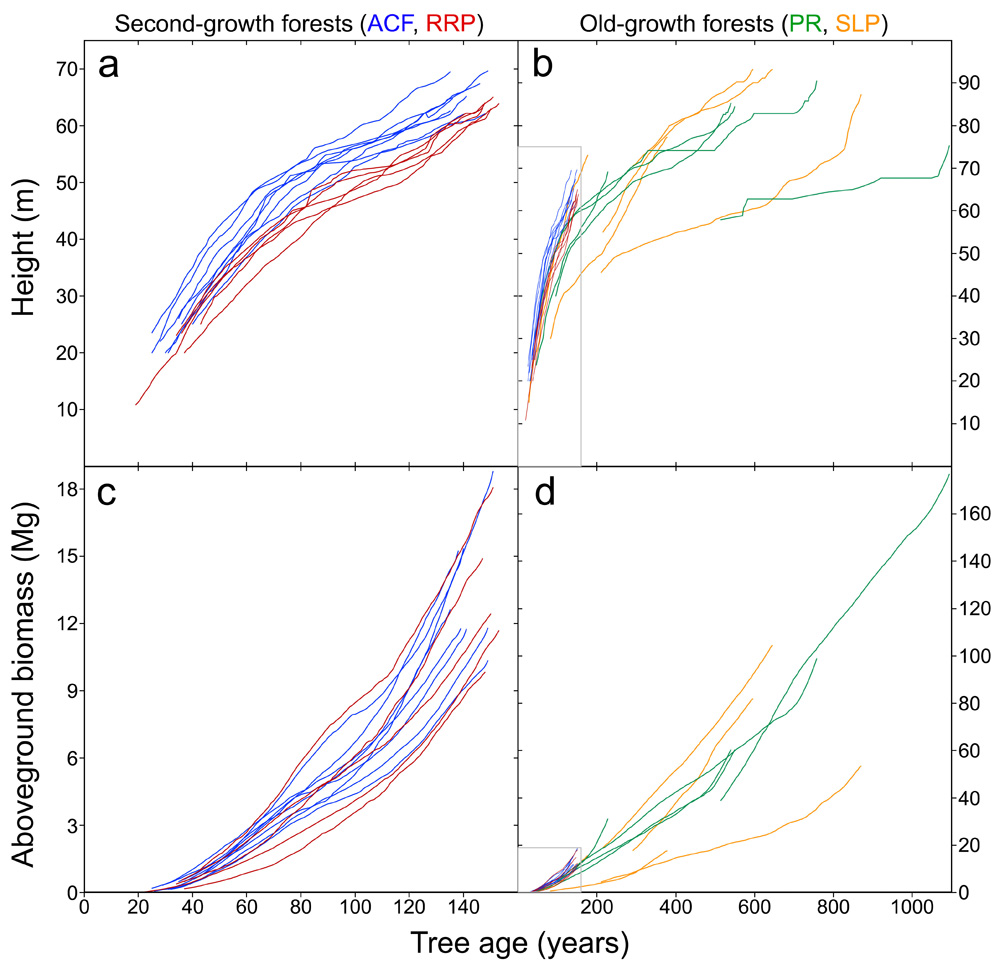 FIGURE 4: BIOMASS RECOVERY. Intensive trunk measurements, including core-sampling at regular height intervals, permits examination of tree growth histories, showing that tree height increases much more rapidly than aboveground biomass. This illustrates that while forest height might recover relatively quickly in second-growth forests, biomass accumulation, and therefore significant carbon storage, takes much longer to recover. Shown here are time series for 23 coast redwoods in relatively wet and dry second-growth and old-growth forests, respectively. The wet forests are both in Humboldt County (ACF = Arcata Community Forest, PR = Humboldt Redwoods State Park), and the dry forests are in Alameda and Contra Costa (RRP = Redwood Regional Park) and Monterey (SLP = Santa Lucia Preserve) counties. Each line represents an individual tree, whose height is reconstructed via diameter measurements combined with dendrochronology. Biomass is predicted as a function of main trunk wood volume decremented at annual increments. Age is calculated by subtraction from year of measurement. Tree age at year of measurement is estimated by regressing trunk ages at 10-m-height intervals against height and predicting age at ground level (Sillett et al. 2015, 2019). The gray boxes in lower-left corners of charts b and d show scales of charts a and c, respectively.
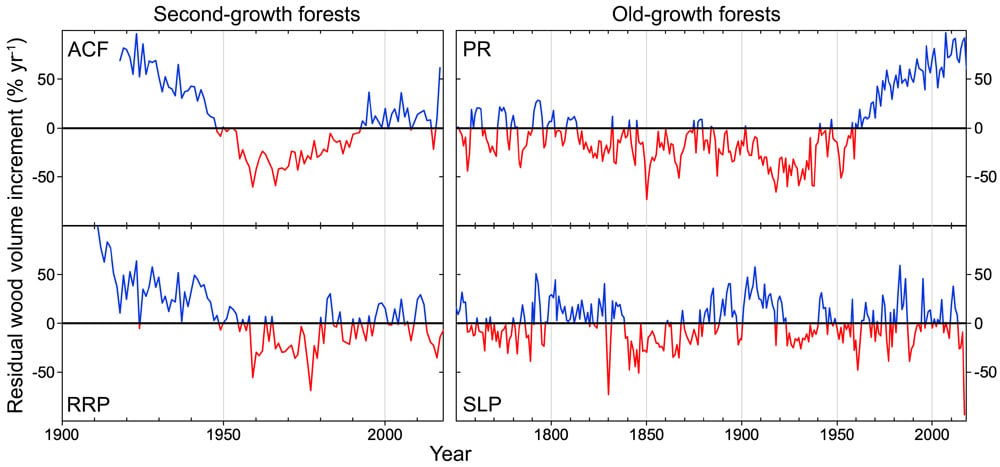
FIGURE 5: REDWOOD GROWTH TRENDS. This time series of coast redwood productivity in second-growth and old-growth forests, with wetter forests on top, shows how redwood growth trends in different forests vary significantly. Redwoods at Peavine Ridge (PR), a wet old-growth forest, exhibit a remarkable growth surge since the 1950s that was not observed in the second-growth or drier old-growth forest. Shown here are residual wood volume increments (RWVI) of 4 to 8 trees combined at each location. RWVI is expressed as a percentage and computed as measured trunk wood volume increment (m3 yr-1) divided by the amount expected under a null hypothesis of uniform growing conditions, where cambium expands at the mean annual rate and wood production is proportional to trunk size. In each time series, blue indicates years when trunks produced more wood, and red indicates years when trunks produced less wood than expected for their size.
Redwoods of Peavine Ridge exhibited unusually rapid growth during the 21st century, and their main trunks produced much more wood than expected for their size (FIGURE 5). Dating back to the 1300s, growth was relatively sluggish in this ridgetop forest until higher light availability — presumably from improving air quality and reduced summer cloudiness (Carroll et al. 2014, Sillett et al. 2015b) — triggered increasingly wide annual rings starting about 1960 (FIGURE 6). Redwoods in the old-growth forest of the Santa Lucia Preserve (SLP), however, did not exhibit such a growth surge in recent decades. These trees endured the Soberanes Fire in 2016 immediately after the drought, and as a result exhibited negligible growth in 2017 while recovering damaged leaves and roots, as well as producing a massive crop of seed cones. Note that the SLP growth history suggests a similar event in 1829 with very little wood production in 1830 (FIGURE 5).
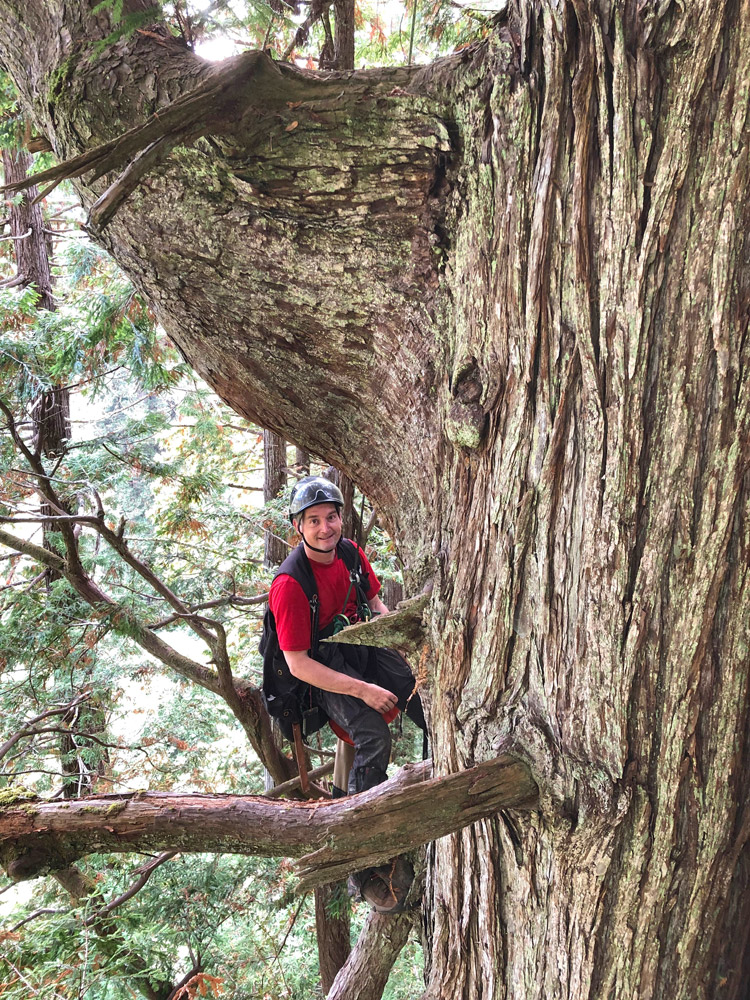
collect tree-ring samples from trunks as part of the Redwoods and Climate Change Initiative. Photo by Marie Antoine.
Wood production in mature second-growth forests differed from what was observed in old-growth forests. Following logging in the mid- to late 19th century, redwoods reclaimed these forests as stump sprouts and newly established seedlings and grew quickly until the late 1940s when growing space was largely reoccupied (FIGURE 5). Competition for resources and poor air quality may explain lower-than-expected growth during the second half of the 20th century in both second-growth forests. Note that redwoods in Arcata Community Forest (ACF) exhibited higher wood production during the recent drought than those in Redwood Regional Park (RRP). Moreover, in 2017, the year after drought ended, wood production at ACF increased dramatically in contrast to RRP.
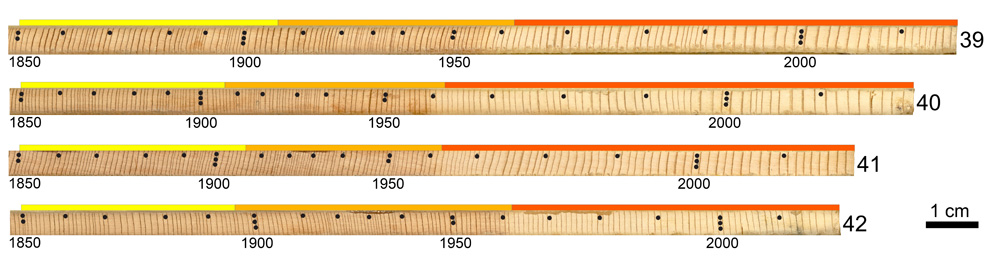
FIGURE 6: CORES. These are scanned images of increment cores collected 30 m above the ground from four coast redwoods (trees 39 to 42) in an old-growth forest (PR = Humboldt Redwoods State Park). Black dots mark 10-, 50-, and 100-year intervals on cross-dated annual rings spanning California state history through 2018 (rings farthest to right). Colored bars above cores span 56-year intervals, highlighting unusually rapid growth since 1960 due to higher light availability — presumably from improving air quality and reduced summer cloudiness (see PR in Figure 5).
Two trees in particular exemplify the remarkable resilience of the species to withstand disturbances and recover high rates of productivity (FIGURE 7). A lone redwood (tree 13) in Arcata survived 19th-century logging but was damaged and suffered from poor growing conditions as the town was built. Within the last few decades however, this veteran tree dramatically increased its rate of growth, resulting in higher-than-expected wood production during the 21st century. Aboveground biomass of this 285-year-old individual is now increasing by up to 500 kg yr-1, because it recovered a full crown with nearly 2,900 m2 of leaves and virtually no shade from neighboring trees. Similarly, in Del Norte County, a 704-year-old redwood (tree 49) with nearly 7,700 m2 (1.9 acres) of leaves in Redwood Experimental Forest witnessed logging of an adjacent forest during the 20th century. Now tree 49 is exhibiting exceptional growth, producing over 1,000 kg yr-1 so far during the 21st century. In 2014, its aboveground biomass increased by an astonishing 1,275 kg (2,811 pounds), which is the fastest growth rate known for any tree worldwide.
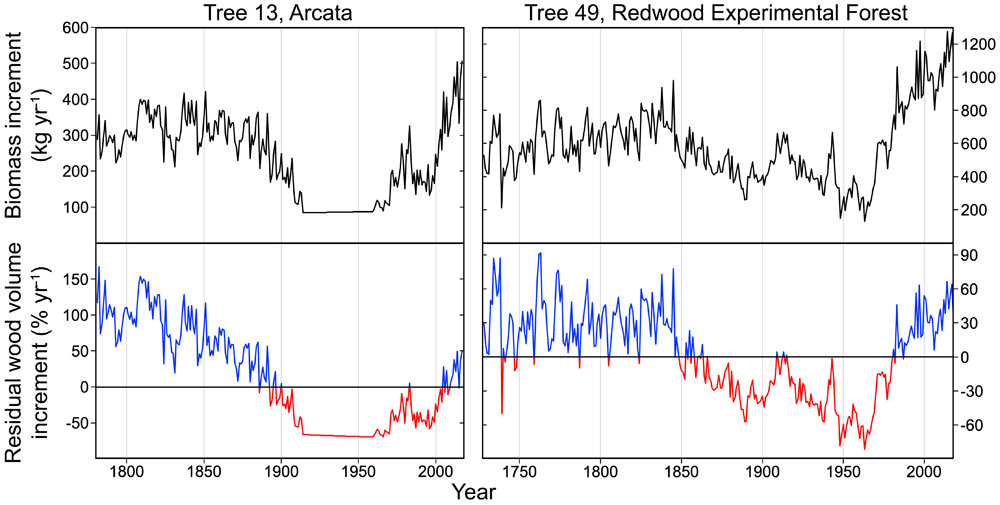
FIGURE 7: REDWOOD PRODUCTIVITY. This time series shows coast redwood productivity for two veterans that survived logging and that exhibit exemplary growth rates in recent decades. It took more than a century for 285-year-old tree 13 in the city of Arcata to recover from damage inflicted during the city’s construction. In Del Norte County, the 704-year-old tree 49 in Redwood Experimental Forest is the fastest growing tree known worldwide, producing over 1,000 kg yr-1 of biomass. Upper panels chart biomass increments (kilograms per year). Lower panels chart residual wood volume increments (see Figure 5 for RWVI definition, with blue indicating years when trunks produced more wood and red indicating years when trunks produced less wood than expected for their size. Note that the apparently stable growth period in tree 13 is an artifact of this period not being cross-dated. The sum of measured ring widths from 1914 to 1959 is divided evenly such that main trunk wood radii change at a constant rate.
Stories of individual trees and redwood forests continue to emerge through the RCCI, and so far, they clearly demonstrate the responsiveness of the species to environmental change. Logging eliminates carbon stores when trees are removed, setting forests back to a young state of rapid growth.
After more than a century, redwood forests recovering from 19th-century logging have accumulated more biomass than nearly any forest ever measured.
Only superlative old-growth forests dominated by coast redwoods, giant sequoia (Sequoiadendron giganteum), Douglas-firs (Pseudotsuga menziesii), and the species of eucalyptus, Eucalyptus regnans, have higher aboveground biomass (Sillett et al. 2015a, 2018; Van Pelt et al. 2016). In both old-growth and second-growth forests across California, redwoods continue to thrive and exhibit resilience to disturbances, including drought and fire, even though productivity is significantly lower in drier forests and immediately after fire (Carroll et al. 2018ab).
In the years ahead, we will extend RCCI research across the landscape and track growth of coast redwoods and giant sequoia under a variety of land-use histories, topographic positions, and climatic conditions.
All of our data confirm the vital importance of protecting and restoring these forests throughout their natural range, not least because of their incredible carbon storage capacity and proven viability as a long-term carbon sink.
As of 2019, we find no evidence of redwoods retreating from native forests as the climate changes. These iconic trees are growing at faster-than-expected rates, thereby enhancing arboreal habitats for other species (Sillett and Van Pelt 2007) and playing an outsized role in global climate mitigation despite their limited geographic distribution.
About the authors
Emily Burns, the League’s former Director of Science, led the research program that includes the Redwoods and Climate Change Initiative. She holds a PhD in Integrative Biology on the impacts of fog on coast redwood forest flora from the University of California, Berkeley.
Professor Stephen C. Sillett is the Kenneth L. Fisher Chair of Redwood Forest Ecology in the College of Natural Resources & Sciences at Humboldt State University. Learn more at humboldt.edu/redwoods.
References
Carroll, A.L., Sillett, S.C., Kramer, R.D. 2014. Millennium-scale crossdating and inter-annual climate sensitivities of standing California redwoods. PLOS ONE 9: 1-18, e102545.
Carroll, A.L., Sillett, S.C, Van Pelt, R. 2018a. Tree-ring indicators of fire in two old-growth coast redwood forests. Fire Ecology 14: 85-105.
Carroll, A.L., Sillett, S.C., Palladini, M., Campbell-Spickler, J. 2018b. Dendrochronological analysis of Sequoia sempervirens in an interior old-growth forest. Dendrochronologia 52: 29-39.
Sillett, S.C., Van Pelt, R. 2007. Trunk reiteration promotes epiphytes and water storage in an old-growth redwood forest canopy. Ecological Monographs 77: 335-359.
Sillett, S.C., Van Pelt, R., Kramer, R.D., Carroll, A.L., Koch, G.W. 2015a. Biomass and growth potential of Eucalyptus regnans up to 100 m tall. Forest Ecology and Management 348: 78-91.
Sillett, S.C., Van Pelt, R., Carroll, A.L., Kramer, R.D., Ambrose, A.R., Trask, D. 2015b. How do tree structure and old age affect growth potential of California redwoods? Ecological Monographs 85: 181-212.
Sillett, S.C., Van Pelt, R., Freund, J.A., Campbell-Spickler, J., Carroll, A.L., Kramer, R.D. 2018. Development and dominance of Douglas-fir in North American rainforests. Forest Ecology and Management 429: 93-114.
Sillett, S.C., Van Pelt, R., Carroll, A.Lx., Campbell-Spickler, J., Coonen, E.J., Iberle, B. 2019. Allometric equations for Sequoia sempervirens in forests of different ages. Forest Ecology and Management 433: 349-363.
Van Pelt, R., Sillett, S.C., Kruse, W.A., Freund, J.A., Kramer, R.D. 2016. Emergent crowns and light-use complementarity lead to global maximum biomass and leaf area in Sequoia sempervirens forests. Forest Ecology and Management 375: 279-308.


6 Responses to “Discovering the Climate Change Resilience of Coast Redwood Forests”
Mark Graham
Can you clarify what improved air quality starting around 1960 means? Are you referring to increased CO2 levels in the atmosphere?
Save the Redwoods League
Improved air quality refers to a reduced amount of particulates in the air as a result of the closure of some incinerators in Humboldt County in the 1970s. That was also around the time of the Clean Air Act, which also likely contributed to better air quality. Those reductions of particulates in the air allowed more light to reach the trees, as did the overall decline in fog cover over the same period.
Thanks for asking!
Linda Wright
We have a mere 4 acres of young redwoods – guessing 2nd growth? – in McKinleyville, Humboldt County, thriving and dominant in mixed forest with Doug-firs, dogwoods, etc. and surrounded by pastures, farmland, and similar swaths of forest. This article helps me appreciate how they are growing in a whole new dimension! I wish I knew more about the history of the local McKinleyville-area redwoods, we don’t see the huge old-growth stumps around that are common elsewhere in HumCo. Can anyone recommend a reference?
Save the Redwoods League
Hi Linda,
Thank you so much for the comment! Redwood stumps were often either removed completely or burned to create more grazing pasture. There was also a lot of Sitka spruce forest in the McKinleyville area, and those stumps would not persist for very long because the wood is not as hardy or rot-resistant as that of redwoods.
Franklin Graham
The resilience of redwoods is remarkable. For so long it was assumed that because we live in the last area where redwoods exist it was thought that they were in danger of extinction. Now, we see a chance for redwoods to thrive in spite of all that is going on with climate change. We possess but 20 acres of redwood forest, second growth. But for us our trees are doing their bit.
Save the Redwoods League
Thanks Franklin for the comment!